News
Microsoft Details Improvements to Power BI for Office 365 Preview
- By Kurt Mackie
- September 25, 2013
Microsoft on Wednesday announced some new features in the preview version of Power BI for Office 365.
Power BI is Microsoft's self-service business intelligence product that taps Microsoft's Excel spreadsheet application, various Excel add-ins tools, as well as some Office 365 cloud-based solutions. The Power BI concept involves finding data sources with Power Query, modeling data in Power Pivot and displaying data with Power Map or Power View. An overview of Power BI for Office 365, as well as a list of its components, can be found in this article.
The overall product is still at the preview stage, but Microsoft updated some parts of it Wednesday. Power BI for Office 365 had its debut in July.
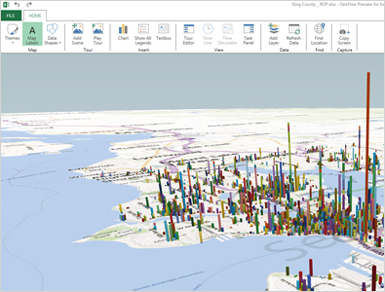
The Power Map preview for Excel 2013 has been updated this month and is available at the Microsoft Download Center here. Microsoft added color coding for geopolitical areas to the Power Map preview, which can be done via county, state, county/region or zip code, according to an Excel blog post. The geocoding all gets assembled through one click in Power Map, according a Microsoft Research blog post.
 Plotting geographical data points using Power Map. (Source: Microsoft)
Also added to Power Map preview was a two-dimensional mapping capability alongside the existing 3-D mapping (globe) feature, which users can switch between. Microsoft also made it easier to share videos of data tours, such as time-lapse mappings of data. The example Microsoft offers is a historical mapping of power sources used across the United States, which is described in this Microsoft-produced video.
The Microsoft Bing team helped to build the improved temporal and geographic mapping capabilities of the Power Map preview, as well as with the "natural language" querying capabilities of Q&A. The Q&A feature of Power BI for Office 365 interprets the type of data visualization to display in response to queries typed by a user into a text box, based on the underlying data model that was constructed.
The Power Query add-in for Excel now has an improved search experience, according to a Microsoft SQL Server blog post. It's easier to import external data from SQL Server or the Windows Azure SQL Database. Access to datasets from data.gov, Wikipedia and the Windows Azure Marketplace was added.
Power Pivot also now includes support for calculated fields and hidden columns, according to Microsoft's Excel blog post.
There were a few other improvements. Power BI Sites now supports viewing Excel workbooks as large as 250 MB. Data queries can be shared, in addition to Excel workbooks. IT departments can provision data via a "data catalog" feature of Power BI for Office 365, allowing knowledge workers to access corporate data stores.
Microsoft also released Power BI apps for Windows 8 or Windows RT devices in its Windows Store. These apps support HTML 5 technologies for rendering visuals, according to Microsoft. The HTML 5 support is a major difference from on-premises mobile BI support using Microsoft technologies, which still rely on Silverlight for BI displays.
There's still no word on when Microsoft will roll out the Power BI for Office 365 product. The product is expected to be sold on a subscription basis, like other Office 365 offerings.
About the Author
Kurt Mackie is senior news producer for 1105 Media's Converge360 group.